Console
prodigenr::setup_project("~/Desktop/medical-statistics")🚧 This section is being actively worked on. 🚧
The slides contain speaking notes that you can view by pressing ‘S’ on the keyboard.
To repeat from the official syllabus, our main tangible goal is to:
The learning goals are as follows:
Knowledge
Skills
Competences
A cardiology department at a regional hospital has been collaborating with a pharmaceutical company developing a new diagnostic support tool for chest pain patients. Before deciding whether to include your hospital in a larger clinical trial, the company asks for a quick baseline summary of your recent patients: “Nothing complicated—just basic descriptive numbers so our statisticians can take a look.”
You are given a dataset of 303 patients admitted with chest pain (age, cholesterol, blood pressure, heart rate, etc.), along with whether they were later confirmed to have coronary artery disease. Your supervisor tells you: “This is not a statistics task—we just need simple summaries like average values and variability for key variables. The statisticians will handle the rest.” Later that day, you receive a follow-up email: “Please report mean and standard deviation for age, cholesterol, resting blood pressure, and max heart rate, stratified by heart disease status. We need it today to decide whether your site qualifies.”
Because it is the first session, take it slowly. Regularly check for learner’s understanding and make use of the stickies/hats to do so.
To do data analysis effectively and in an organised and less stressful way, everything comes down to how you setup and structure your folders and files. Essentially, how to make your analysis project into a self-contained project at the folder level. This session will cover how to set up a project into an RStudio R Project and structure the files and folders using the prodigenr package.
Time: ~5 minutes
Before we create a project, we should first define what we mean by “project”. What is a project? In a research context, a project is a set of files that together lead to some type of scientific “output” or “product”, for instance a scientific document. Use data for your output? That’s part of the project. Do any analysis on the data to give some results? Also part of the project. Write a document based on the data and results? Have figures inserted into the output document? These are also part of the project.
More and more how we make a claim in a scientific product is just as important as the output describing the claim. This includes not only the written description of the methods but also the exact steps taken, that is, the code used. So, using a project file organization can help with keeping things self-contained and easier to track and link with your scientific product. Here are some things to consider when working in projects:
These simple steps can be huge steps toward being reproducible in your analysis. And by managing your projects in a reproducible fashion, you’ll not only make your science better and more rigorous, it also makes your life easier too!
RStudio helps us with managing projects by making use of R Projects. RStudio R Projects make it easy to divide your work projects into a “container”, that have their own working directory (the folder where your analysis occurs), workspace (where all the R activity and output is temporarily saved), history, and documents.
There are many ways one could organise a project folder. We’ll be setting up a project folder and file structure using prodigenr. We’ll use RStudio’s “New Project” menu item under “File -> New Project…”. A new pop-up window shows up. Click “New directory” and scroll down to “Scientific Analysis Project using prodigenr”. Type out medical-statistics as the directory name and save it to the Desktop/.
You can also type the below function into the Console, but we won’t do that in this session.
Console
prodigenr::setup_project("~/Desktop/medical-statistics")After we’ve created a New Project in RStudio, we’ll have a bunch of new files and folders.
LearningR
├── .git/
├── R/
│   └── README.md
├── data/
│   └── README.md
├── data-raw/
│   └── README.md
├── docs/
│   └── README.md
├── .gitignore
├── DESCRIPTION
├── medical-statistics.Rproj
├── README.md
└── TODO.md
This forces a specific and consistent folder structure to all your work. Think of this like the “Introduction”, “Methods”, “Results”, and “Discussion” sections of your paper. Each project is then like a single scientific report, that contains everything relevant to that specific project. There is a lot of power in something as simple as a consistent file and folder structure. Projects are used to make life easier. Once a project is opened within RStudio the following actions are automatically taken:
Each R project is designated with a .Rproj file. This file contains information about the file path and various metadata. So, when opening an R project, you need to open it using the .Rproj file.
A project can be opened by either double clicking on the .Rproj from your file browser or from the file prompt within R Studio:
File -> Open Projector
File -> Recent Project.. -> medical-statisticsWithin the project we created, there are several README files in each folder that explain a bit about what should be placed there. Briefly:
docs/ directory, including Quarto files.data/ directory or in data-raw/ for the raw data. We’ll explain this more later..R files (called scripts) and code should be in the R/ directory.You’ve already gotten a bit familiar with RStudio in the pre-course tasks, but if you want more details, RStudio has a great cheat sheet on how to use RStudio. The items to know right now are the “Console”, “Files”/“Help”, and “Source” tabs.
Code is written in the “Source” tab, where it saves the code and text as a file. You can send selected code to the Console from the opened file by typing Ctrl-EnterCtrl-Enter (or clicking the “Run” button). In the “Source” tab (where R scripts and Quarto files are shown), there is a “Document Outline” button (top right beside the “Run” button) that shows you the headers or “Sections” (more on that later). To open it you can either click the button, use the keybinding Ctrl-Shift-OCtrl-Shift-O or with the Palette (Ctrl-Shift-PCtrl-Shift-P, then type “outline”), go through the menu to Code -> Show Document Outline. The Command Palette is a very useful tool to learn, since you can easily access almost all features and options inside RStudio through it. Because of this reason, we will be using it a lot throughout the course. Open it up with Ctrl-Shift-PCtrl-Shift-P and then in the pop-up search bar, type out “document outline”. The first item should be the one we want, so hit Enter to activate the Outline.
If you can’t remember a specific keybinding in RStudio, check out the help for it by going to the menu item Help -> Keyboard Shortcuts Help.
Time: ~5 minutes
Before moving on, let’s go over a bit about how R works, and what the “R session” means. An R session is the way you normally interact with R, where you would write code in the Console to tell R to do something. Normally, when you open an R session without an R Project, the session defaults to assuming you will be working in the ~/Desktop or ~ (your Home folder) location. But this location usually isn’t where you actually work and where your R code is. You normally work in the folder that has your R scripts, Quarto documents, or data files. The assumption with R Projects on the other hand, is that the R session’s working directory should be where the R Project is, since that is where you have your R scripts and data files.
R can be used as a simple calculator - try writing:
2 + 2In R, everything is an object and every action is a function. A function is also an object, but an object isn’t always a function. To create an object, also called a variable, we use the <- assignment operator. So, if we want to create an object called weight_kilos and assign it the value 100, we would write:
weight_kilos <- 100The new object now stores the value we assigned it. We can read it like:
“
weight_kiloscontains the number 100” or “put 100 into the objectweight_kilos”
In order to show the stored values, you can print the values in your console by typing the name of the object:
weight_kilosWe can name our objects the way we like. There are almost no restrictions.
-, nor colon, :, in the naming (nor *, +, % and other crazy things)_, and dots, .
There are also several main “classes” (or types) of objects in R: lists, vectors, matrices, and data frames. For now, the only two we will cover are vectors and data frames. A vector is a string of values, while a data frame is multiple vectors put together as columns. Data frames are a form of data that you’d typically see as a spreadsheet. This type of data is called “rectangular data” since it has two dimensions: columns and rows.
So these are vectors, which have different types like character, number, or factor:
Notice how we use the # to write comments or notes. Whatever we write after the “hash” (#) tells R to ignore it and not run it.
This is what a data frame looks like, if we look at the built-in dataset called airquality, which is a data frame object loaded by default when you start R:
head(airquality)# A tibble: 6 × 6
Ozone Solar.R Wind Temp Month Day
<int> <int> <dbl> <int> <int> <int>
1 41 190 7.4 67 5 1
2 36 118 8 72 5 2
3 12 149 12.6 74 5 3
4 18 313 11.5 62 5 4
5 NA NA 14.3 56 5 5
6 28 NA 14.9 66 5 6The c() function puts values together and head() prints the first 6 rows. Both c() and head() are functions since they do an action and they can be recognized by the () at their end. Functions take an input (known as arguments) and give back an output. Each argument is separated by a comma ,. Some functions can take unlimited number of arguments (like c()). Others, like head() can only take a few arguments. In the case of head(), the first argument requires a data frame object.
mean() is also a nice function, so we don’t have to compute it by hand all the time.
As you start to run R code, you’re likely to run into problems. Don’t worry — it happens to everyone. We have all been writing R code for years, but every day we still write code that doesn’t work on the first try!
Start by carefully comparing the code that you’re running to the code we use in the course. R is extremely picky, and a misplaced character can make all the difference. Make sure that every ( is matched with a ) and every " is paired with another ". Sometimes you’ll run the code and nothing happens. Check the left-hand of your console: if it’s a +, it means that R doesn’t think you’ve typed a complete expression and it’s waiting for you to finish it. In this case, it’s usually easy to start from scratch again by pressing ESCAPE to abort processing the current command.
If you’re still stuck, try ?. Consider the scenario where you learn about a new function or become interested in using a function for a different purpose. Let’s say you want to learn more about mean(). You simply write a ? before the function and RStudio will show you documentation about the function and possible suggestions of how to use it correctly in different scenarios - cool, right? Like this:
?mean()You can also get help about any R function by highlighting the function name and pressing F1 in RStudio. Don’t worry if the help doesn’t seem that helpful - instead skip down to the examples and look for code that matches what you’re trying to do.
If that doesn’t help, carefully read the error message. Sometimes the answer will be buried there! But when you’re new to R, even if the answer is in the error message, you might not yet know how to understand it. Another great tool is Google: try googling the error message, as it’s likely someone else has had the same problem, and has gotten help online.
One of the major strengths of R, and many other programming languages, is in its ability for other people to create packages that simplify doing complex tasks. For example, if you need to use mixed effects models for your data analysis, you can use the lme4 package. Or if you want to create figures you can use the ggplot2 package. As you experienced from the pre-course tasks, installing packages is easy by using install.packages(). Whenever we work with R, we very rarely work only with the base R functions. We usually use a lot of functions from many other packages, because that is one of the easiest ways for you to simplify your work! No need to re-invent the wheel 😁
One “meta-package” we will use throughout the course is called tidyverse. So let’s load the package up so we can use the functions from inside it.
The way you load a package and get access to the functions inside is by using the library() function. So let’s load the dplyr package by writing library(dplyr).
Let’s run this code by placing the cursor over the code and using Ctrl-EnterCtrl-Enter. After you run the code, you should see some text that might look something like this:
Attaching package: 'dplyr'The following objects are masked from 'package:stats':
filter, lagThe following objects are masked from 'package:base':
intersect, setdiff, setequal, union|>
The pipe, |> or %>%, is a handy way to write multiple lines of R code.
You choose which pipe to use in the menu: - Tools > Global Options > Code (tick “Use native pipe…”)
|> is pronounced as “and then”.
It can take a variable and then compute the mean:
instead of this notation:
mean(values)Which reads: take the mean of values.
It does not make a big difference in this example but later we will see how the pipe helps us break code into chunks that are easier to read, write, debug, extend, modify and combine.
DATA |>
  some_change_to_the_data() |>
  a_subsequent_operation() |>
  ... |>
  final_operation_or_plot()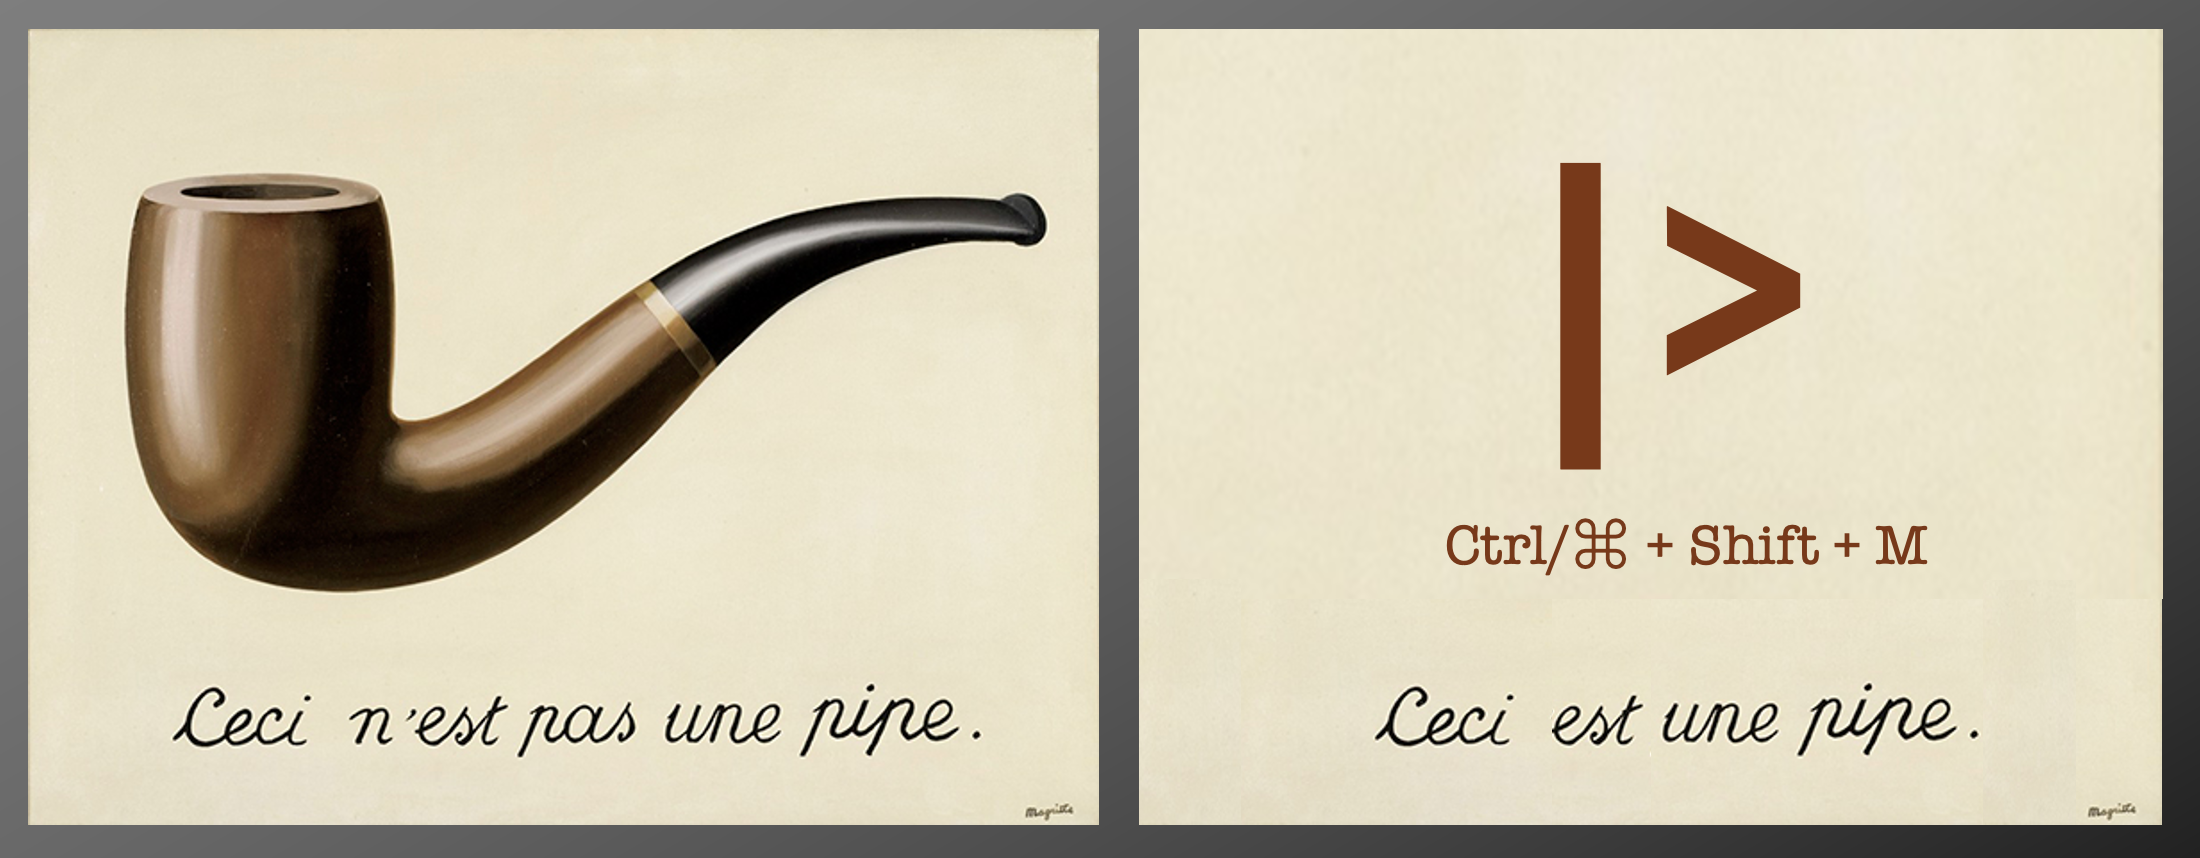
Basic piping:
x |> f() is equivalent to f(x) x |> f(y) is equivalent to f(x, y) x |> f() |> g() |> h() is equivalent to h(g(f(x)))
You have already tried reading in data. The command was:
SUA_data <- readr::read_csv(
  "https://zenodo.org/records/8292712/files/SUA_CVDs_risk_factors.csv"
)
Rows: 25744 Columns: 15
── Column specification ────────────────────────────────────────────────
Delimiter: ","
dbl (15): ID, sex, Age, BMI, SBP, DBP, FBG, TC, Cr, GFR, UA, Times, ...
ℹ Use `spec()` to retrieve the full column specification for this data.
ℹ Specify the column types or set `show_col_types = FALSE` to quiet this message.Here, we used the readr package to read a csv file from the course website using the function read_csv(). As we haven’t loaded the readr package, R doesn’t know that there’s a function called read_csv(). Instead of loading the entire library of functions (using library(readr)), we simply tell R to find the readr package and look for the function read_csv() using colon-colon package::function.
If you wanted to store or save a csv-file, you could write the csv file to your computer using write_csv(). Here, you need to specify where you want the file. For now, we will store it in the medical-statistics/data-raw/ folder and name the file SUA_data:
readr::write_csv(SUA_data, "data-raw/SUA_data.csv")You can always read more about the function using ?readr::write_csv
View() function.
As R is case sensitive, view() will now work - try it!
r {view} view(SUA_data) # Will produce an error # Instead try: View(SUA_data)
The mean() function also works on datasets. However, we need to specify which variable it should take the mean of.
We do this by either selecting it with the $ sign:
mean(SUA_data$Age)[1] 69.38102Another approach is to use the dplyr function pull():
Both yield the same result. The first is quick but can be difficult to extend or even read.
The dplyr-version is easy to read and more flexible when we want to do more operations.
numeric,character,logic, and factor.Please complete the survey for this session:
You have been tasked with the responsibility as medical expert on a clinical trial. The projects’ statistician want’s you to give her some information in order for her to start her work.
The data is stored in .csv format and the company has provided you access to a GDPR-friendly and secure server where all the company data are stored. The only software installed on the server is R and RStudio.
Søren, 45 yours old, Male, farther of three
Søren was recently diagnosed with cancer. The cancer is malignant but he’s not particularly affected by it yet. The oncology team has proposed he could receive either chemotherapy, surgery, or radio therapy. He’s unsure which treatment to opt in to. You read a paper in which the OR was x, y, z, the RR was x, y, z, and the AR was x, y, z.
Which recommendation would you give Søren?
You notice a sub-group of the patients in the ICU die after leaving the ICU, while another sub-population recover well. You plan to test the mortality between the two in order to determine wither the sub-groups really differ.
Which considerations should you have?
You work at a pharmaceutical company which is planning a clinical trial. The company wants to know how many patients to include. It turns out that your colleagues came up with different numbers between 100 and 1000. Which is correct and why did they come up with different answers?
The company want to go with the lowest level of patients due to economy. How can you evaluate this?
You have been tasked to be the medical expert on a clinical trial. The projects’ statistician want’s you to draft a SAP for her. You need to give the statistician some information in order for her to start her work.
The learning objectives for this session are:
TODO: Reading text
Time: ~NUM minutes.
Text
Time: ~Num minutes.
Text
Time: ~Num minutes.
Text
Everything for this session will be practiced and expanded on in the exercises.
Further material:
Dedicate at least 15 minutes for this part in the end of the session